Statistics
On the main page of the dashboard, you can view integrated statistics for all added sites.
This page also contains a chart showing how many reports were created using the widget in total, as well as how many errors occurred when submitting a report.
You can also view charts for each individual site on the site's page.
Charts
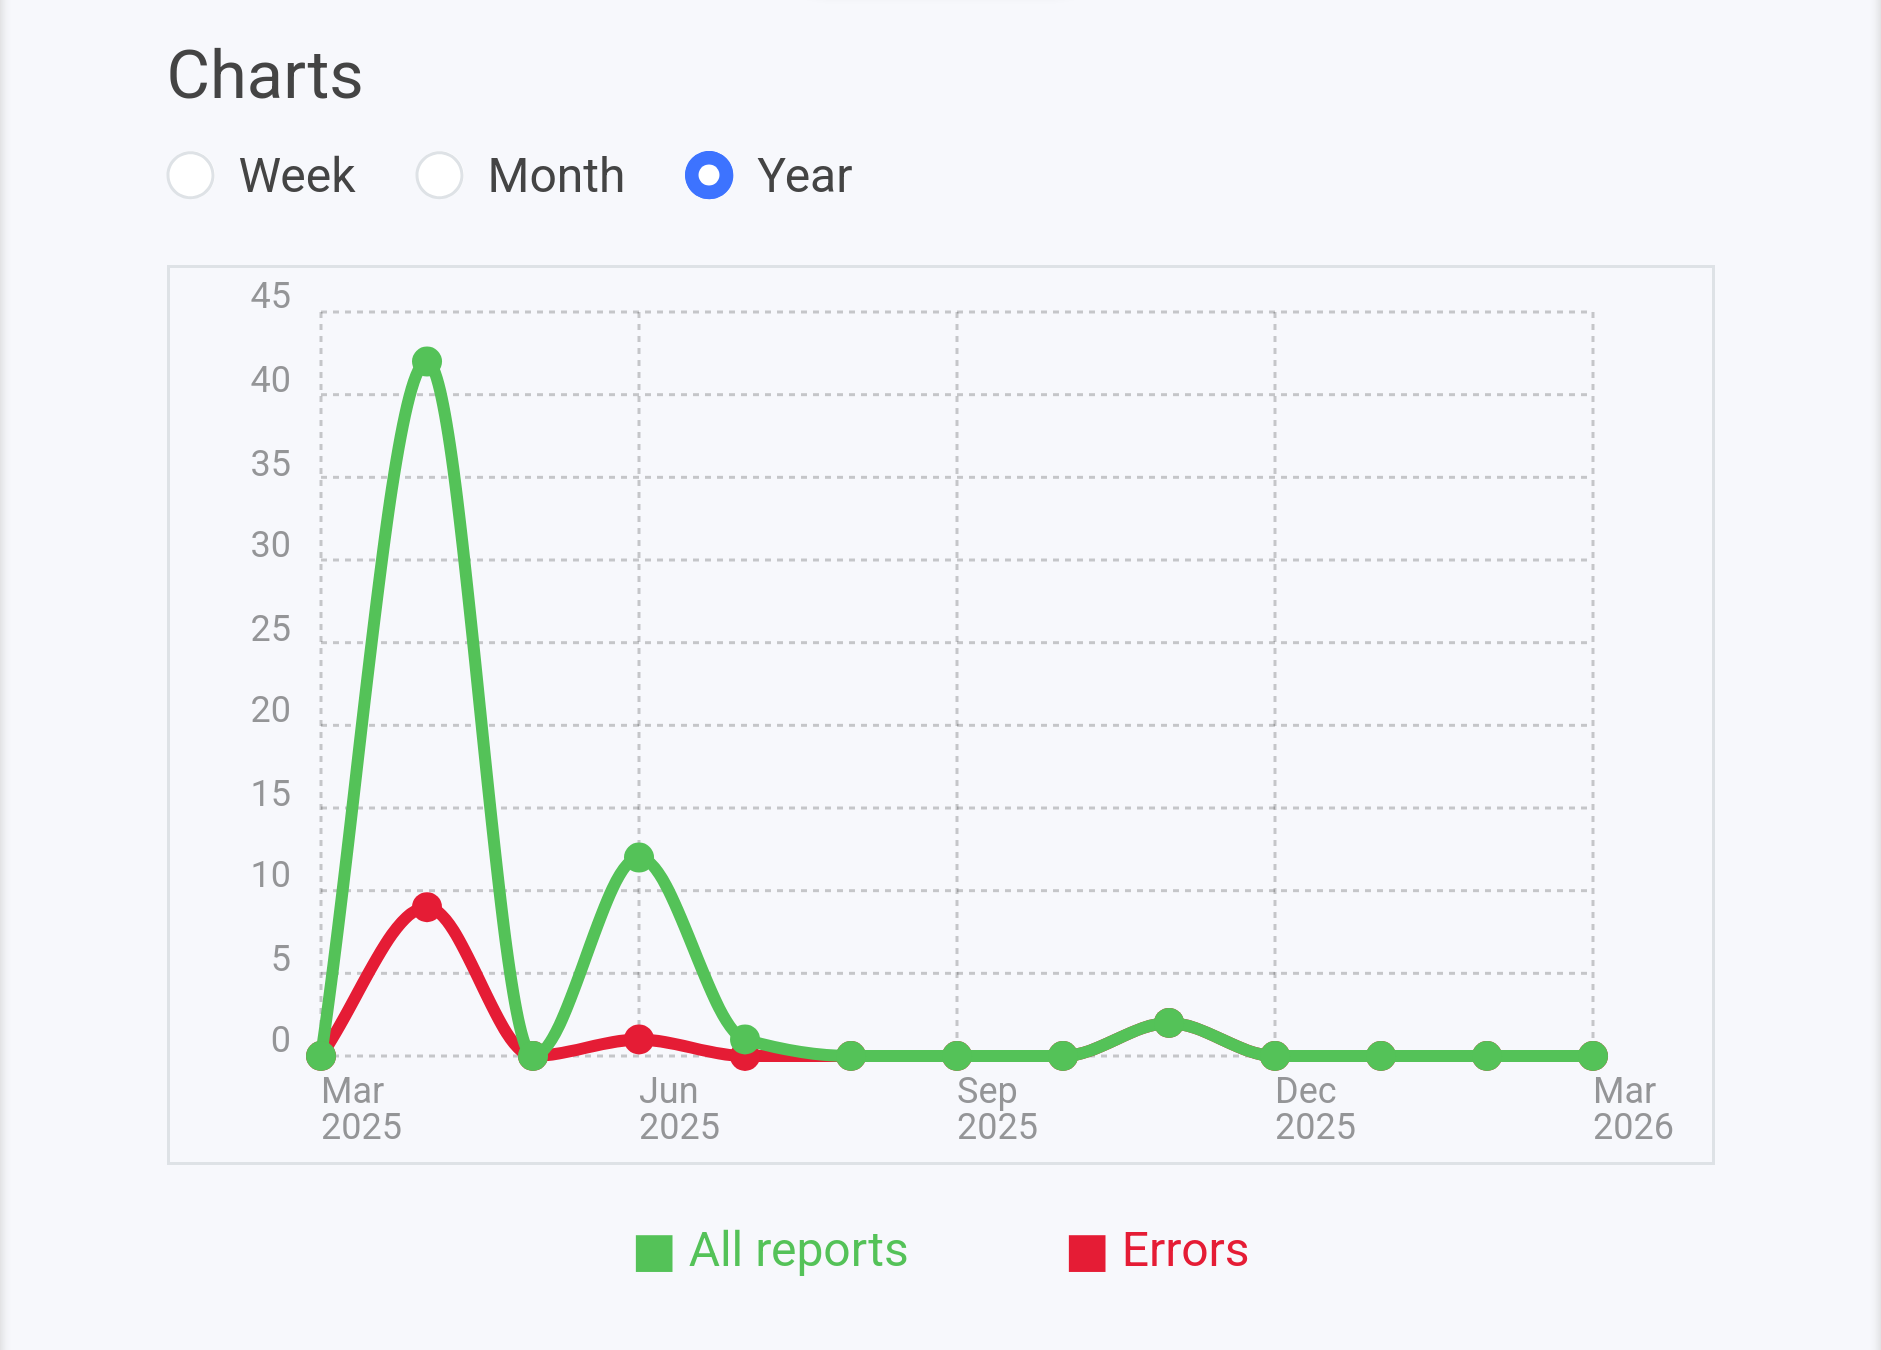
You can select a time period for the chart:
- week (by day)
- month (by day)
- year (by month)
The chart shows two parameters - the total number of reports (green line) and the number of reports with errors (red line). An error refers to a BugBee error when transmitting a report to integrated services.